
Strategic Energy Management (SEM) integrates energy management into business practices for sustained energy savings. As part of SEM programs, specific energy-saving actions, termed ‘energy projects,’ or ‘energy saving measures’ are identified. When SEM participant companies implement the projects, the energy savings and emissions reductions are realized. Unfortunately, not all identified projects are implemented.
To improve the quality of SEM programs and increase the likelihood of realizing the full potential of savings stemming from them, our team undertook the following analysis to delve into the question of which projects once identified are actually implemented.
We examined over 17,000 energy measures from 14 SEM programs across North America, involving 425 industrial sites, using data from our Energy Sensei platform.
SEM participants implement various energy-saving measures, which include low-cost actions and strategic or capital-intensive projects.
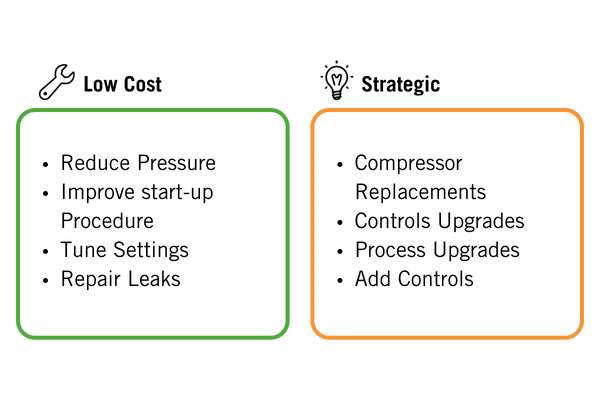
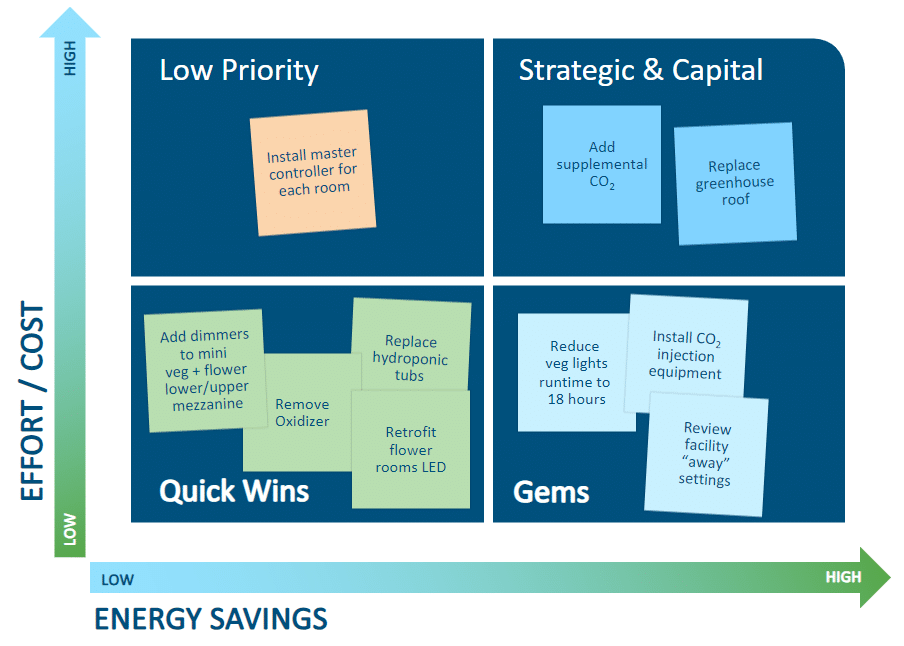
These projects can be ranked by a dual system that analyzes both (i) the potential for energy savings, and (ii) the level of effort and costs for implementation. Looking at the graphic below, the relationship between these two attributes becomes apparent. In particular the potential attractiveness for low-cost projects that have high potential energy savings results, “Gems”, and conversely the unattractive high-cost projects, with little potential to generate energy savings “Low Priority”. Gems and Quick Wins both share the low barrier to entry, while the Strategic & Capital projects and the Gems share the potential for high savings.
Considering the types of projects that are identified during SEM, focusing on electricity savings, we sought to discover which of these project groupings and what size projects most contribute to current results of SEM.
We have access to an unprecedented data source of SEM measures in our energy performance platform, Energy Sensei. Our users track over 60,000 energy projects in Sensei, and we created an aggregated and anonymized data set of over 17,000 measures across 14 SEM programs from coast to coast where our licensing agreements allowed us to aggregate and anonymize the data. This dataset spans 425 industrial sites.
For this analysis, we focused on electricity savings, although some of the SEM programs also track natural gas savings. We found that the median year one savings is about 270,000 kWh or about 3% of baseline use. On average, 75% incremental savings are achieved in year 2, meaning if a participant saves 100,000 kWh savings in year 1, on average they save an additional 75,000 kWh in year 2.
Our general hypothesis was this: These SEM results are achieved by completing many smaller actions.
What we found is that a lot of small measures add up to achieve meaningful results. However, larger projects (like those that save over 500,000 kWh) have an outsized impact on total savings. The mean savings per completed large measure is 126,000 kWh – much higher than the 30,000 kWh median.
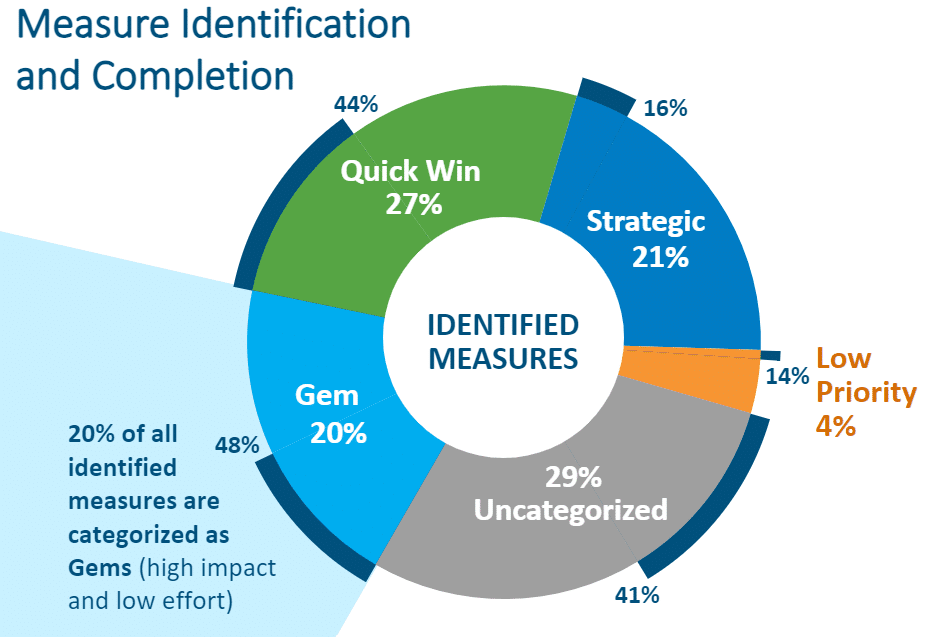
Of the total identified projects, 20% are Gems, 29% are uncategorized, 27% are Quick Wins, 21% are Strategic & Capital, and 4% are Low Priority. Project types are explained in Image 1 above. Projects can be labeled as uncategorized for a myriad of reasons, for example, they could be energy management projects, learning assignments, etc.
Looking at the completion rate of identified projects, 48% of Gems are completed, 41% of uncategorized, 44% of Quick Wins, 16% of Strategic & Capital, and 14% of Low Priority.
The highest completion rate is Gems, which shows that the prioritization process is working, as seen in Image 1.
Looking at what types of projects produced energy savings, we found that 35% of savings came from Gems, 9% from Quick Wins and 26% from Strategic & Capital. This finding further stresses the importance of completing Gem projects, and also highlights the value of fostering capital projects during SEM engagements.
Most measures were identified during treasure hunts, and by isolating those measures, we found that 82% of completed measures are completed within one year of the Treasure Hunt where they are identified, with the fastest pace of completion in the first 100 days. This finding shows that treasure hunts drive action. Note that this one-year timeline is not related to when savings are claimed or in which program year.
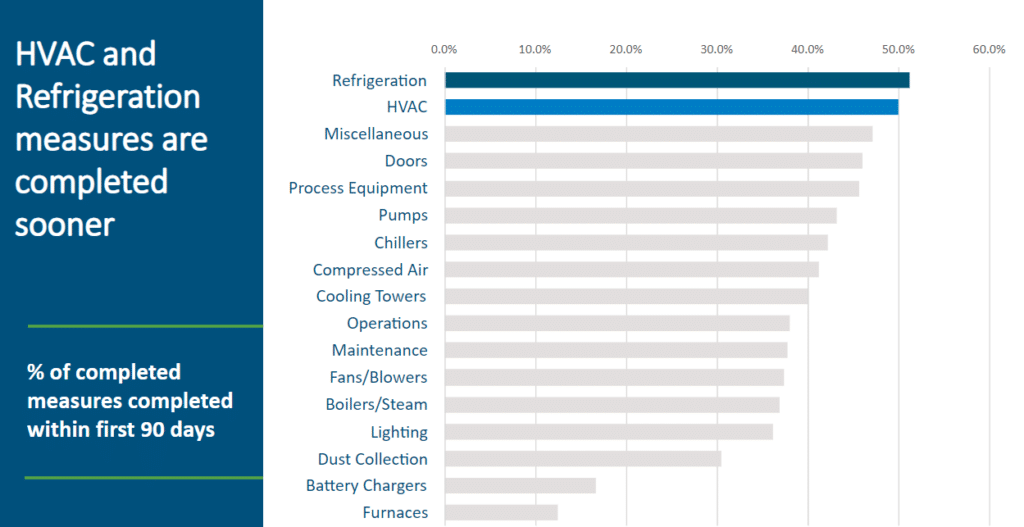
From our data set, we found that the measures that are most likely to be completed in the first 90 days are Refrigeration and HVAC energy measures.
We also compared the overall measure completion rate by subsystem.
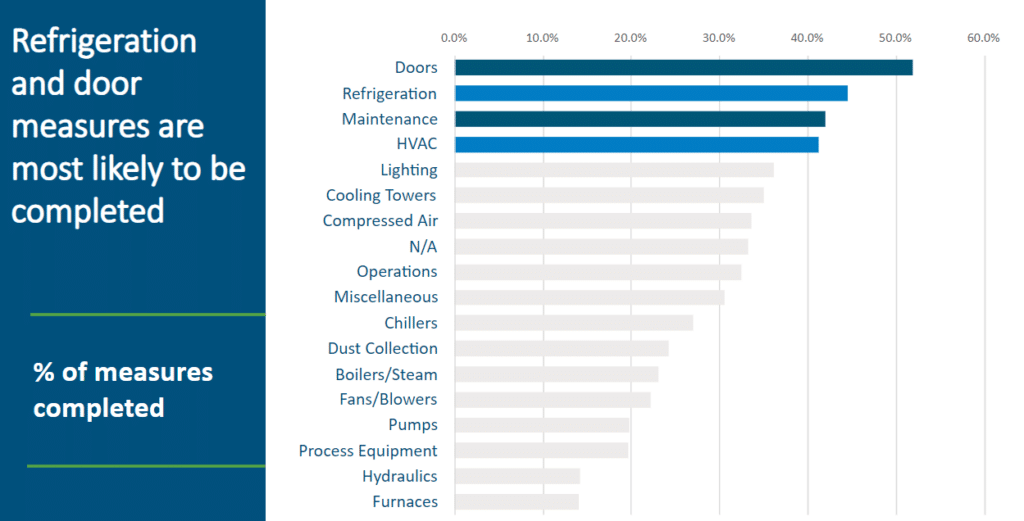
Refrigeration and HVAC were also among the subsystems with the highest completion rate.
We can conclude that Refrigeration and HVAC measures are more likely to be completed and completed quickly, resulting in early SEM energy savings. What do those systems have in common? Often, they have controls that can be tuned more easily than other systems.
From our analysis of these 17,000 energy measures, here are the key findings and takeaways:
1. Median measures save 30,000 kWh, but large measures play an outsized role.
Takeaway: To save the most energy, we need to promote a high volume of measures AND foster the large measures.
2. Participants complete 16 measures per site, across 6 different subsystems.
Takeaway: Participation in SEM results in measures completed across the facility, including harder-to-reach subsystems. SEM is not just about lighting and compressed air optimization.
3. Treasure hunts drive activity.
Takeaway: Do treasure hunts early and often
4. 52% of Gems and 80% of Strategic measures remain incomplete, suggesting significant potential for further savings.
Takeaway: Use continuous or alumni programs to continue focus on these projects. Keep the SEM coach in place as a trusted resource.
5. Refrigeration and HVAC related projects are those most likely to be chosen early in the program, and the most likely to be completed.
Takeaway: All customers have setpoints; optimize to gain early traction
Datasets like these allow Cascade to make data-driven decisions to improve our program designs.
These insights will guide the expansion of SEM programs, focusing on the most impactful energy-saving measures. For further details on SEM and program suitability, interested parties can contact our SEM coaches.